In 2023, the landscape of global corporate taxation witnessed pivotal adjustments. With 13 countries revising their statutory corporate income tax rates, the global economic community saw a mix of rate increases and decreases. This report delves into these changes, highlighting the nations with the highest and lowest tax rates, and explores the influence of the OECD’s Pillar Two agreement on global tax policies.
Key Findings
- In 2023, 13 nations adjusted their corporate tax rates. Notably, six countries, including Belarus and the UK, escalated their rates, while seven, such as Austria and Guinea, reduced theirs.
- Comoros, Puerto Rico, and Suriname stand out with the highest corporate tax rates globally, while Barbados, Turkmenistan, and Hungary feature the lowest.
- The OECD’s Pillar Two agreement is prompting tax policy reforms in jurisdictions previously without corporate income tax, like the UAE and Bermuda.
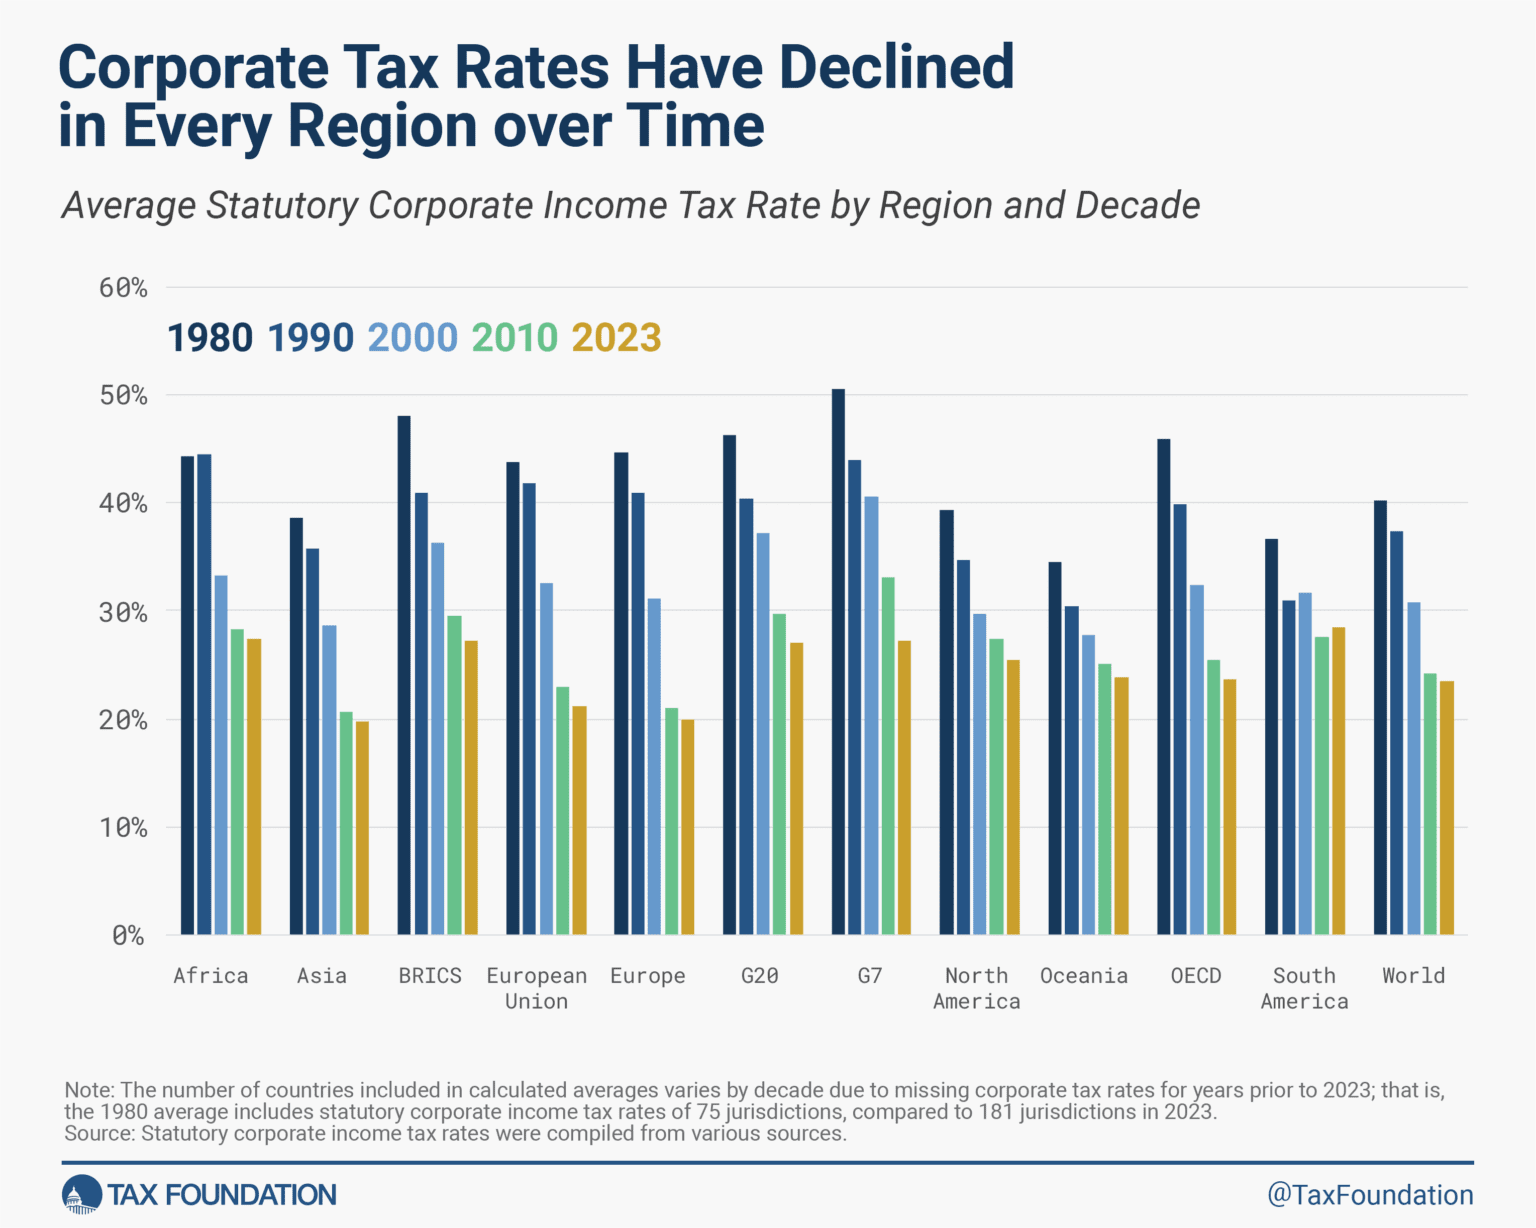
- The global average statutory corporate tax rate is 23.45%, with Asia reporting the lowest and South America the highest regional averages.
Detailed Analysis
1. Notable Corporate Tax Rate Changes in 2023
In a significant shift, 13 countries modified their corporate tax structures. While Belarus, Morocco, Sri Lanka, Turkey, the UAE, and the UK opted for increases, seven others, spanning continents, chose to lower their rates, reflecting diverse economic strategies and responses to global trends.
2. Corporate Tax Extremes: Highs and Lows
Highest Corporate Tax Rates
- Comoros: Tops the chart with a 50% rate, highlighting its unique tax policy.
- Puerto Rico and Suriname: Follow with 37.5% and 36% rates, respectively, illustrating regional tax policy diversity.
Lowest Corporate Tax Rates
- Barbados: Offers the lowest rate at 5.5%, making it an attractive business destination.
- Turkmenistan and Hungary: Also stand out with low rates of 8% and 9%, respectively.
3. The Impact of the OECD’s Global Minimum Tax
The OECD’s Pillar Two agreement is reshaping the tax landscape, compelling nations like the UAE to introduce new corporate taxes and others like Bermuda to consider tax reforms, aligning with the global push for a 15% minimum tax rate.
Tables and Commentary
Table 1: Notable Corporate Income Tax Rate Changes in 2023
This table presents a detailed account of the countries that adjusted their tax rates in 2023, showcasing the global reaction to evolving economic and regulatory environments.
| Country | 2022 Tax Rate | 2023 Tax Rate | Change from 2022 to 2023 |
|---|---|---|---|
| Africa | |||
| Guinea | 35% | 25% | -10 ppt |
| Morocco | 31% | 32% | +1 ppt |
| South Africa | 28% | 27% | -1 ppt |
| Asia | |||
| United Arab Emirates | 0% | 9% | +9 ppt |
| Bangladesh | 30% | 27.5% | -2.5 ppt |
| Republic of Korea | 27.5% | 26.5% | -1 ppt |
| Sri Lanka | 24% | 30% | +6 ppt |
| Turkey | 23% | 25% | +2 ppt |
| Europe | |||
| Austria | 25% | 24% | -1 ppt |
| Belarus | 18% | 20% | +2 ppt |
| United Kingdom | 19% | 25% | +6 ppt |
| North America | |||
| Aruba | 25% | 22% | -3 ppt |
| Saint Vincent and the Grenadines | 30% | 28% | -2 ppt |
Table 1 provides a comprehensive look at the shifts in corporate income tax rates across various countries in 2023, reflecting a mosaic of economic strategies and responses to the global and local fiscal environment. These changes underscore the agility and diversity of tax policy adjustments as nations navigate economic challenges and opportunities.
Detailed Analysis by Region
- Africa:
- Guinea: The significant reduction in Guinea’s corporate tax rate from 35% to 25% might reflect an aggressive strategy to stimulate economic growth and attract foreign investment, especially in key sectors like mining and agriculture.
- Morocco: A slight increase in Morocco’s rate from 31% to 32% could be aimed at bolstering government revenues for developmental projects, balancing investor attractiveness with fiscal sustainability.
- South Africa: The modest decrease in South Africa’s tax rate from 28% to 27% suggests a nuanced approach to enhancing business competitiveness while maintaining a stable revenue base.
- Asia:
- United Arab Emirates: The introduction of a 9% tax rate marks a significant policy shift, aligning with global tax standards and diversifying revenue sources beyond oil.
- Bangladesh, Republic of Korea, and Sri Lanka: These changes reflect nuanced adjustments to align with broader economic goals, whether to stimulate growth, attract investment, or manage fiscal needs.
- Turkey: The increase from 23% to 25% might be geared towards fiscal consolidation, addressing economic challenges while ensuring competitiveness.
- Europe:
- Austria and Belarus: Both countries’ adjustments, albeit in opposite directions, indicate a recalibration of tax policies to foster economic resilience and growth.
- United Kingdom: The notable increase from 19% to 25% could be part of a broader strategy to address fiscal pressures while maintaining a balanced economic growth approach.
- North America:
- Aruba and Saint Vincent and the Grenadines: These reductions could be aimed at enhancing the appeal of these jurisdictions for business investment, crucial for economies heavily reliant on sectors like tourism and services.
Strategic Implications
- Global Tax Competition: The table reflects the ongoing global tax competition, where countries strategically adjust rates to position themselves as attractive destinations for business investment.
- Economic and Fiscal Strategy: The varied changes underscore each country’s unique approach to leveraging corporate tax rates as a tool for economic strategy, balancing between attracting investment, fostering growth, and managing public finances.
- Investment Decision Influence: For multinational corporations, these changes are critical data points, influencing decisions on where to allocate resources, establish operations, or expand business activities.
The alterations in corporate tax rates in 2023 are indicative of the dynamic and responsive nature of global tax policy-making. As countries aim to optimize their fiscal environments in response to both external and internal pressures, these changes offer a window into the broader economic priorities and strategies shaping our interconnected global economy.
Table 2: 20 Highest Statutory Corporate Income Tax Rates in the World, 2023
Highlighting the top 20 countries with the highest corporate tax rates, this table reveals regional disparities and policy choices that shape global economic dynamics.
| Country | Continent | Tax Rate |
|---|---|---|
| Comoros* | Africa | 50% |
| Puerto Rico | North America | 37.5% |
| Suriname | South America | 36% |
| Argentina | South America | 35% |
| Chad | Africa | 35% |
| Colombia | South America | 35% |
| Cuba | North America | 35% |
| Equatorial Guinea | Africa | 35% |
| Malta | Europe | 35% |
| Sudan | Africa | 35% |
| Sint Maarten (Dutch part) | North America | 34.5% |
| American Samoa | Oceania | 34% |
| Brazil | South America | 34% |
| Venezuela (Bolivarian Republic of) | South America | 34% |
| Cameroon | Africa | 33% |
| Saint Kitts and Nevis | North America | 33% |
| Morocco | Africa | 32% |
| Mozambique | Africa | 32% |
| Namibia | Africa | 32% |
| Portugal | Europe | 31.5% |
Note: The normal corporate tax rate is 35 percent, which applies to both Comorian companies and foreign companies deriving Comorian-source income. However, public industrial and commercial enterprises or those where the state or certain public institutions are participants are subject to a corporate tax rate of 50 percent if their turnover exceeds 500 million Comorian francs; see Bloomberg Tax, “Country Guides: Comoros,” https://www.bloomberglaw.com/product/tax/document/25590833704.
Sources: Statutory corporate income tax rates are from OECD, “Table II.1. Statutory corporate income tax rate,” updated April 2023, https://stats.oecd.org/index.aspx?DataSetCode=Table_II1 and “Statutory Corporate Income Tax Rates,” updated November 2023, https://stats.oecd.org/index.aspx?DataSetCode=CTS_CIT; PwC, “Worldwide Tax Summaries – Corporate Taxes,” 2023, https://taxsummaries.pwc.com/; Bloomberg Tax, “Country Guides – Corporate Tax Rates,” accessed November 2023,
Table 2 delineates the countries with the highest corporate tax rates across the globe in 2023, showcasing a significant spectrum of rates that reflect diverse economic, political, and regional strategies. This table illustrates not just the figures but also the broader economic contexts that motivate these countries to maintain higher corporate tax rates.
Analysis of Selected Jurisdictions
- Comoros (Africa, 50%): Standing at the top with a 50% tax rate, Comoros represents the apex of corporate tax rates globally. This high rate reflects Comoros’ unique economic strategy, potentially aimed at generating substantial government revenue from a limited number of corporate entities, given the country’s small economic base.
- Puerto Rico (North America, 37.5%): As a U.S. territory, Puerto Rico’s tax rate is notable, especially given its efforts to attract investment and stimulate economic growth amidst fiscal challenges. The high corporate tax rate is part of a complex fiscal framework influenced by its relationship with the United States and its own economic recovery strategies.
- Suriname (South America, 36%): In South America, Suriname’s tax rate is indicative of the region’s trend toward higher corporate taxes. This could be attributed to various factors, including economic development goals, social welfare funding needs, or resource allocation strategies in a country rich in natural resources.
- Portugal (Europe, 31.5%): Representing Europe, Portugal’s position on this list underscores the diversity within the continent itself in terms of tax policy. The country’s higher tax rate might reflect broader fiscal policies aimed at stabilizing the economy, reducing public debt, and funding social programs.
Regional Insights
- Africa and South America’s Prominence: The list’s representation indicates a trend where regions like Africa and South America have relatively higher corporate tax rates. This could be reflective of economic strategies where these countries leverage higher corporate taxes to fund public expenditure, infrastructure, and development programs.
- Strategic Implications: For multinational companies, understanding these tax landscapes is crucial for global strategy and investment decisions. Regions with higher corporate tax rates might need to offer other incentives to attract foreign investment or may rely more on domestic business growth.
The countries with the highest corporate tax rates in the world adopt these strategies within their unique economic contexts, balancing the need for revenue with the desire to foster business growth and investment. These rates are indicative of broader economic policies and priorities, with significant implications for international business operations and global economic dynamics. Understanding the rationale behind these high tax rates provides deeper insights into each country’s economic strategy and the global fiscal landscape’s complexity.
Table 3: 20 Lowest Statutory Corporate Income Tax Rates in the World, 2023 (Excluding Jurisdictions with a Corporate Income Tax Rate of Zero Percent)
This table reveals the countries with the lowest corporate tax rates, offering insights into the competitive tax environments designed to attract business investments. Notably, a mix of countries from various continents are represented, reflecting diverse economic strategies.
| Country | Continent | Tax Rate |
|---|---|---|
| Barbados | North America | 5.5% |
| Turkmenistan | Asia | 8% |
| Hungary | Europe | 9% |
| United Arab Emirates | Asia | 9% |
| Andorra | Europe | 10% |
| Bosnia and Herzegovina | Europe | 10% |
| Bulgaria | Europe | 10% |
| Republic of Kosovo | Europe | 10% |
| Kyrgyzstan | Asia | 10% |
| Paraguay | South America | 10% |
| Qatar | Asia | 10% |
| The Former Yugoslav Republic of Macedonia | Europe | 10% |
| Timor-Leste | Oceania | 10% |
| China, Macao Special Administrative Region | Asia | 12% |
| Republic of Moldova | Europe | 12% |
| Cyprus | Europe | 12.5% |
| Gibraltar | Europe | 12.5% |
| Ireland | Europe | 12.5% |
| Liechtenstein | Europe | 12.5% |
| Albania | Europe | 15% |
Sources: OECD, “Table II.1. Statutory corporate income tax rate” and “Statutory Corporate Income Tax Rates”; PwC, “Worldwide Tax Summaries – Corporate Taxes”; Bloomberg Tax, “Country Guides – Corporate Tax Rates”; and researched individually, see Tax Foundation, “worldwide-corporate-tax-rates.”
Table 3 provides a detailed snapshot of the countries with the lowest corporate tax rates globally, excluding those with a zero percent rate. This strategic positioning on tax rates is indicative of each country’s broader economic policies and intent to create an attractive environment for international businesses and investors.
Analysis of Selected Jurisdictions
- Barbados (North America, 5.5%): With one of the world’s lowest corporate tax rates, Barbados aims to position itself as a premier investment destination, especially for offshore businesses and financial services. This low tax rate is part of a broader strategy to diversify the economy beyond tourism and leverage its status as an international business center.
- Turkmenistan (Asia, 8%): In Asia, Turkmenistan’s low corporate tax rate reflects its efforts to attract foreign investment and stimulate economic diversification. Given its heavy reliance on natural gas reserves, Turkmenistan is keen on broadening its economic base and sees incentivizing foreign corporate presence as a step toward this goal.
- Hungary (Europe, 9%): Hungary offers one of Europe’s lowest corporate tax rates, a policy aimed at stimulating economic growth, attracting multinational companies, and encouraging domestic investment. This rate is a cornerstone of Hungary’s economic policy, positioning it as a competitive player within the European Union.
- Albania (Europe, 15%): With a corporate tax rate on the lower end of the spectrum, Albania seeks to attract investment and foster economic growth, particularly in sectors beyond its traditional industries. This rate reflects Albania’s commitment to economic reform and integration into broader European markets.
Strategic Implications
- Economic Diversification: For many countries on this list, low corporate tax rates are part of a strategy to diversify their economies, reduce reliance on a single sector, and encourage a broad spectrum of industries to establish operations within their borders.
- Competitive Positioning: These countries leverage their tax policies to differentiate themselves in the global market, aiming to attract businesses that might otherwise invest in nations with higher tax burdens.
- Balancing Act: While low corporate tax rates can attract foreign investment, these countries must balance this with the need to generate sufficient revenue for public services and infrastructure, often necessitating a careful calibration of other forms of taxation or revenue generation.
The countries listed in Table 3 demonstrate the strategic use of corporate tax policy as a tool for economic engagement and competition on the global stage. By offering low corporate tax rates, these nations aim to attract a diverse array of business investments, driving growth and potentially transforming their economic landscapes. Understanding the nuances of these policies offers valuable insights into the interplay between taxation, investment attraction, and economic strategy on a global scale.
Table 4: Countries without General Corporate Income Tax, 2023
This table identifies jurisdictions that eschew a general corporate income tax, highlighting a niche approach to economic strategy and taxation that distinguishes these locales in the global market.
| Country | Continent |
|---|---|
| Anguilla | North America |
| Bahamas | North America |
| Bahrain* | Asia |
| Belize* | North America |
| Bermuda | North America |
| British Virgin Islands | North America |
| Cayman Islands | North America |
| Guernsey | Europe |
| Isle of Man | Europe |
| Jersey | Europe |
| Saint Barthelemy | North America |
| Tokelau | Oceania |
| Turks and Caicos Islands | North America |
| Vanuatu | Oceania |
| Wallis and Futuna Islands | Oceania |
Notes: *Bahrain has no general corporate income tax but has a targeted corporate income tax on oil companies, which can be as high as 46 percent. See Deloitte, “International Tax – Bahrain Highlights 2023,” last updated February 2023, https://www2.deloitte.com/content/dam/Deloitte/global/Documents/Tax/dttl-tax-bahrainhighlights-2023.pdf. In Belize the corporate tax rate is 40 percent but as this rate applies only to the petroleum industry, the corporate tax rate in Belize has been included in this database as 0 percent to ensure consistency of treatment across all jurisdictions. See OECD, “Corporate Tax Statistics 2023,” November 2023, https://doi.org/10.1787/f1f07219-en.
Sources: OECD, “Table II.1. Statutory corporate income tax rate” and “Statutory Corporate Income Tax Rates”; PwC, “Worldwide Tax Summaries – Corporate Taxes”; Bloomberg Tax, “Country Guides – Corporate Tax Rates.”
Table 4 showcases a unique set of jurisdictions that stand out in the global fiscal landscape for their decision not to impose a general corporate income tax. This distinctive strategy not only sets these countries apart but also positions them as attractive destinations for business and investment, particularly appealing to companies seeking to optimize their tax liabilities.
Analysis of Jurisdictions
- Anguilla and Bahamas (North America): These North American island nations leverage their no corporate tax policy as a tool to attract foreign businesses and investments, compensating for smaller local markets and limited natural resources. By offering a tax-friendly environment, they aim to boost their economies through increased capital flow, job creation, and enhanced infrastructure development, relying heavily on other forms of revenue, such as tourism and fees from financial services.
- Bahrain (Asia): As an Asian country, Bahrain’s no corporate tax policy is part of its broader economic diversification strategy. Positioned in a region rich in oil, Bahrain distinguishes itself by creating a conducive environment for various sectors, including banking, finance, and technology. The absence of a corporate tax is a key component of Bahrain’s value proposition to international businesses, aiding its transition towards a more diversified economy.
- Wallis and Futuna Islands (Oceania): This French overseas collectivity exemplifies how remote and smaller jurisdictions can use tax policies to gain a competitive edge. By not imposing a corporate income tax, Wallis and Futuna aim to attract investment that can stimulate local economic activity and reduce dependency on external financial support.
Strategic Implications
- Economic Appeal: The primary allure of these jurisdictions is their ability to attract multinational corporations looking for tax efficiency. This strategy not only draws in businesses but also fosters a climate of international financial services, including banking, insurance, and investment funds.
- Balanced Approach: While the absence of corporate income tax offers significant appeal, these jurisdictions must balance this with the need to provide adequate public services and infrastructure, often relying on other forms of revenue like import duties, property taxes, and service fees.
- Regulatory Scrutiny: These jurisdictions often come under international scrutiny, especially from bodies advocating for global tax transparency and fairness. They must navigate the delicate balance of maintaining an attractive tax policy while complying with international standards to avoid being labeled as tax havens.
The countries listed in Table 4 have adopted a distinctive fiscal approach by not imposing a general corporate income tax, which serves as a critical lever in their economic development strategy. This approach not only differentiates them in the competitive global market but also underscores the diverse fiscal policies that countries can adopt based on their unique economic contexts and strategic priorities. Understanding these jurisdictions provides valuable insights into the complexities and nuances of global tax strategies and their implications for international business and investment.
4. Regional Variation in Corporate Tax Rates
The report underscores significant regional variations, with Asia exhibiting the lowest and South America the highest average corporate tax rates. This section provides a comparative analysis, enhancing understanding of the global tax landscape.
Table 5: Average Corporate Tax Rate by Region or Group, 2023
| Region | Average Rate | Average Rate Weighted by GDP | Number of Countries Covered |
|---|---|---|---|
| Africa | 27.37% | 27.28% | 51 |
| Asia | 19.80% | 25.02% | 47 |
| Europe | 19.92% | 24.49% | 39 |
| North America | 25.46% | 26.10% | 24 |
| Oceania | 23.75% | 29.72% | 8 |
| South America | 28.38% | 32.65% | 12 |
| G7 | 27.18% | 26.68% | 7 |
| OECD | 23.73% | 26.16% | 38 |
| BRICS | 27.20% | 26.11% | 5 |
| European Union | 21.13% | 25.21% | 27 |
| G20 | 27.09% | 26.51% | 19 |
| World | 23.45% | 25.67% | 181 |
Sources: Statutory corporate income tax rates are from OECD, “Table II.1. Statutory corporate income tax rate” and “Statutory Corporate Income Tax Rates”; PwC, “Worldwide Tax Summaries – Corporate Taxes”; Bloomberg Tax, “Country Guides – Corporate Tax Rates”; and some jurisdictions researched individually, see Tax Foundation, “worldwide-corporate-tax-rates.” GDP calculations are from the U.S. Department of Agriculture, “International Macroeconomics Data Set.”
Table 5 offers an insightful comparative analysis of average corporate tax rates across various regions and groups, emphasizing the diversity and influencing factors behind these figures. This detailed examination sheds light on how regional economic structures, political environments, and social dynamics intricately shape tax policies, reflecting broader economic strategies and priorities.
Analysis by Region
- Africa (27.37% Average Rate; 27.28% Weighted by GDP): Africa’s relatively high average corporate tax rate can be attributed to various factors, including the economic heterogeneity of the continent, where many countries are still developing their industrial bases and rely heavily on corporate tax revenues as a crucial fiscal resource. The close alignment of the average rate with the GDP-weighted rate indicates a relatively uniform tax structure across economies of different sizes within the continent.
- Asia (19.80% Average Rate; 25.02% Weighted by GDP): Asia showcases the lowest average corporate tax rate among the regions, reflecting the continent’s aggressive pursuit of economic growth and foreign investment. The notable difference between the average and GDP-weighted rates suggests that larger economies in Asia, possibly with higher tax rates, significantly influence the region’s overall tax rate when adjusted for GDP.
- Europe (19.92% Average Rate; 24.49% Weighted by GDP): Europe’s corporate tax rates are competitively low, indicative of the mature, integrated, and highly competitive economic environment. The variation between the simple average and the GDP-weighted average points to the presence of economic powerhouses within the EU that have higher corporate tax rates, affecting the region’s GDP-weighted average.
Global Context
- World (23.45% Average Rate; 25.67% Weighted by GDP): On a global scale, the average corporate tax rate reflects a blend of diverse tax policies, economic strategies, and development stages across different countries and regions. The higher GDP-weighted global average suggests that larger economies, which often have higher tax rates, disproportionately impact the worldwide average.
Influencing Factors
The variations in corporate tax rates across regions are influenced by multiple factors:
- Economic Strategies: Regions may adopt lower corporate tax rates to attract foreign direct investment (FDI) and stimulate economic growth, while others might maintain higher rates to support public revenue and fund social programs.
- Political and Social Dynamics: Tax policies are also shaped by political ideologies, social priorities, and economic philosophies prevalent in different regions, reflecting a complex interplay of local preferences, global trends, and regional commitments.
- Economic Integration: In regions with significant economic integration, such as the EU, tax policies might be influenced by collaborative fiscal strategies and competition among member states to attract business and investment.
The analysis of average corporate tax rates by region and group offers vital insights into the global fiscal landscape, illustrating how a myriad of factors converges to shape tax policies worldwide. Understanding these nuances provides valuable context for businesses, policymakers, and economists as they navigate the intricate world of international finance and taxation.
The year 2023 marked a notable period in global corporate taxation, reflecting a complex interplay of economic strategies, regional disparities, and international tax reforms. As countries navigate the evolving tax environment, these changes underscore the dynamic nature of global economic governance and its impact on business and investment worldwide.
Conclusion
The primary objective of this article is to provide a comprehensive and detailed overview of the global corporate taxation landscape as it stands in 2023. By highlighting the notable changes in corporate income tax rates across different countries and regions, the article aims to offer valuable insights into the current trends, strategies, and economic considerations that are shaping global tax policies. This analysis serves as a crucial resource for businesses, policymakers, investors, and financial professionals who need to navigate the complexities of international taxation and make informed decisions in a dynamically changing global market.
The article not only delineates the countries with the highest and lowest corporate tax rates but also delves into the nuanced adjustments made by various nations in response to economic, political, and regulatory shifts. Through a detailed examination of these changes, the article seeks to underscore the strategic implications for international business operations and investment planning, providing a holistic view of the global fiscal environment.
Role of Dawgen Global
Dawgen Global plays a pivotal role in the provision of taxation services, acting as a key partner for businesses and organizations navigating the complexities of international tax landscapes. As a provider of comprehensive taxation, accounting, and advisory services, Dawgen Global is dedicated to helping its clients understand and adapt to the ever-evolving tax regulations and policies across different jurisdictions.
Dawgen Global’s expertise in taxation includes:
- Tax Compliance and Planning: Assisting clients in adhering to tax regulations while optimizing their tax strategies to ensure efficiency and effectiveness in alignment with their business objectives.
- International Tax Advisory: Offering insights and guidance on cross-border tax issues, helping businesses navigate the intricacies of multinational operations and international tax treaties.
- Tax Analysis and Insights: Providing up-to-date analyses and reports on global tax developments, like the changes highlighted in this article, enabling clients to make informed decisions and anticipate future trends.
By leveraging its deep expertise and global perspective, Dawgen Global empowers its clients to manage their tax obligations strategically, ensuring compliance, and harnessing tax strategies that align with their broader business goals. Through its tailored services, Dawgen Global contributes to the financial success and operational excellence of businesses operating in the global marketplace.
Next Step!
“Embrace BIG FIRM capabilities without the big firm price at Dawgen Global, your committed partner in carving a pathway to continual progress in the vibrant Caribbean region. Our integrated, multidisciplinary approach is finely tuned to address the unique intricacies and lucrative prospects that the region has to offer. Offering a rich array of services, including audit, accounting, tax, IT, HR, risk management, and more, we facilitate smarter and more effective decisions that set the stage for unprecedented triumphs. Let’s collaborate and craft a future where every decision is a steppingstone to greater success. Reach out to explore a partnership that promises not just growth but a future beaming with opportunities and achievements.
✉️ Email: [email protected] 🌐 Visit: Dawgen Global Website
📞 Caribbean Office: +1876-6655926 / 876-9293670 📲 WhatsApp Global: +1 876 5544445
Join hands with DawgenGlobal. Together, let’s venture into a future brimming with opportunities and achievements.

