 In the pursuit of smart global investment, one cannot overlook the intricate dynamics of income distribution. While GDP and GDP per capita are traditional tools to assess economic strength, they fall short in capturing the true picture of inequality and living standards. A recent visualization of 2024 daily personal incomes, adjusted for purchasing power parity (PPP), highlights how starkly income is distributed across—and within—countries. This insight is not just academic—it holds practical significance for investors navigating global markets.
Understanding the Income Divide
Data from Our World in Data reveals that the richest 10% of Americans earn an average of $156 per day, while the poorest 10% earn about $23—an almost sevenfold difference. Yet this “low” end of the U.S. income scale still surpasses the average income of the top 10% in countries like India ($9), Egypt ($11), and Indonesia ($14).
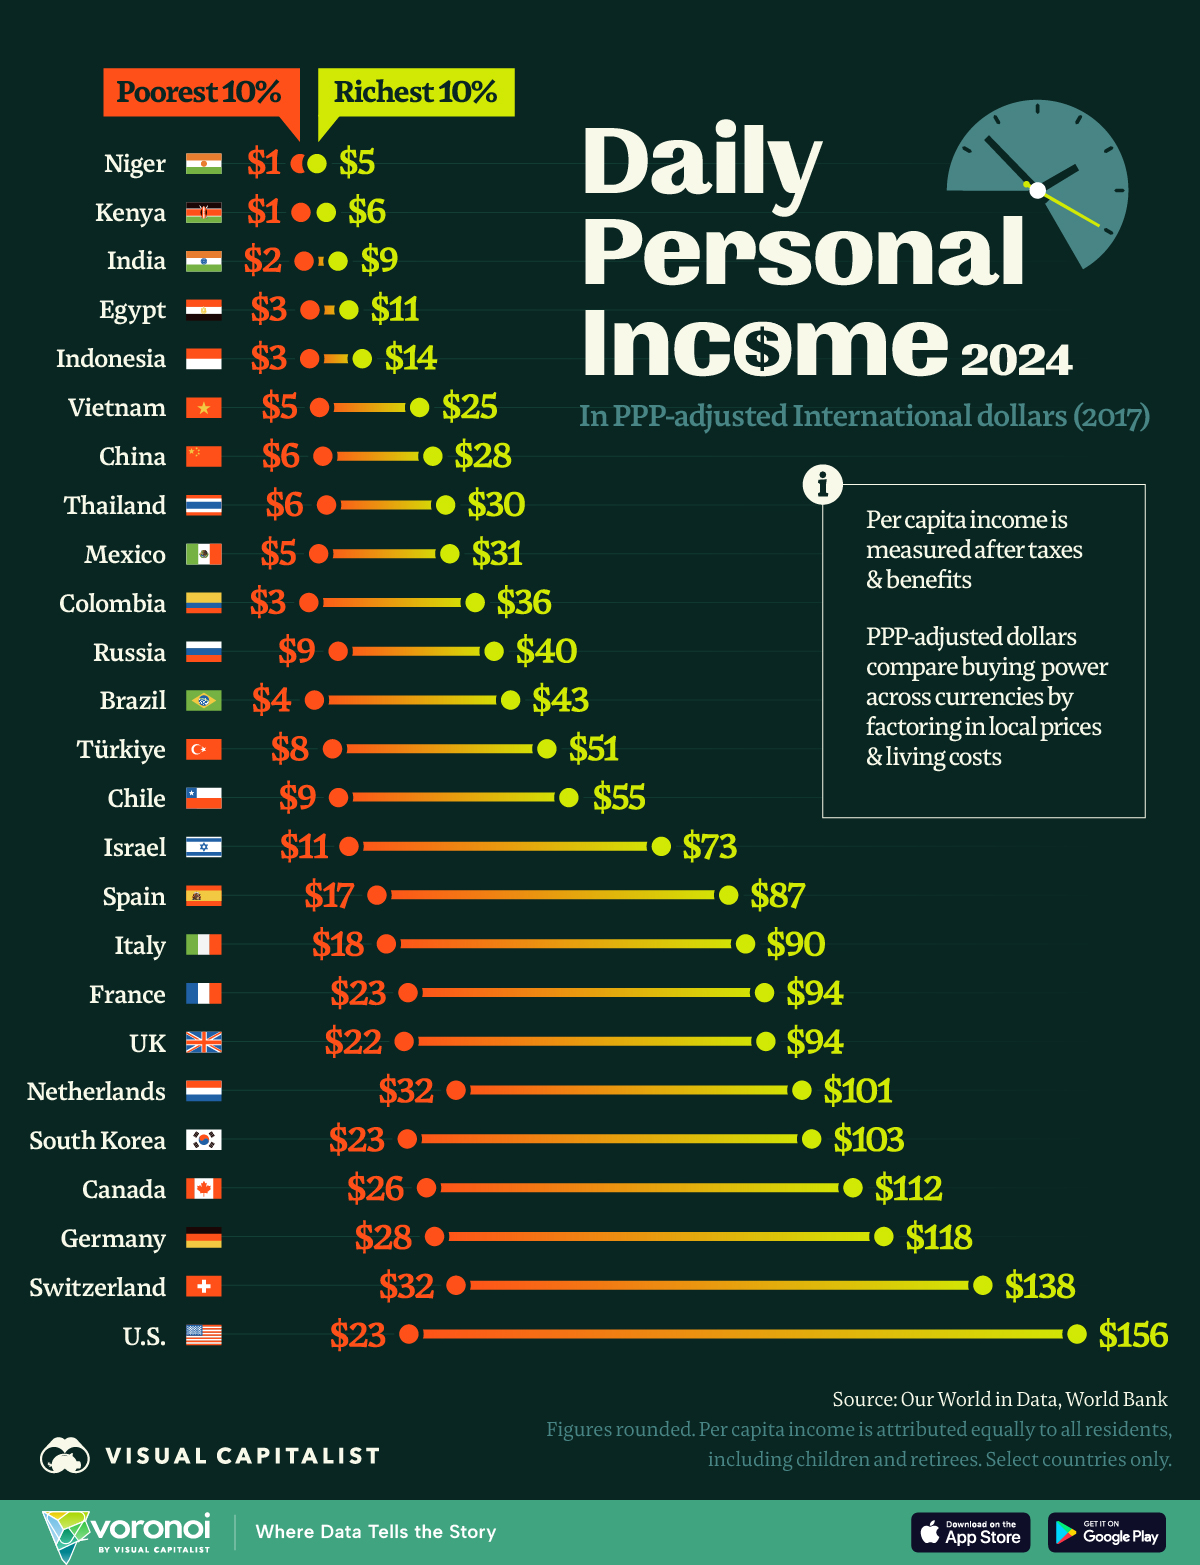
This disparity showcases how, even after adjusting for local prices (via PPP), living standards vary dramatically. The implications of this inequality are profound for companies expanding globally, portfolio managers seeking growth, and governments designing inclusive development strategies.
What This Means for Global Investors
-
Consumer Markets are Not Created Equal
-
The top 10% in Vietnam earn $25/day, while the bottom 10% in the UK make $22. That means product pricing, luxury brand appeal, and even basic consumption potential vary widely—not just across countries, but within them.
-
Investors must consider income tiers rather than national averages when evaluating demand potential for products or services.
-
-
Emerging Market Opportunities Come with Risks
-
Countries like India and Kenya show vast income inequality, and the average working adult likely supports more dependents due to lower per capita income.
-
While these countries offer long-term growth opportunities, structural economic challenges, such as limited purchasing power, must be mitigated through innovation, affordability strategies, and local partnerships.
-
-
Advanced Economies Still Offer Premium Segments
-
Switzerland, the Netherlands, and Germany boast some of the highest per capita daily incomes for their richest 10%—$138, $101, and $118 respectively.
-
These stable, high-income groups remain lucrative for luxury, tech, and high-value services.
-
-
Inequality Signals Political and Economic Volatility
-
When the income gap is extreme, especially in developing economies, it often correlates with social unrest, populist policy swings, and currency instability.
-
This adds a layer of geopolitical risk to investment portfolios.
-
Beyond the Numbers: Rethinking Strategy
While income is presented in PPP-adjusted international dollars (2017 baseline), even this method has limitations. Cultural consumption patterns, local infrastructure, and digital access still skew economic reality. The PPP basket may include items irrelevant in certain markets, affecting true purchasing power.
Moreover, population size matters. The top 10% in the U.S. represents about 34 million people. In India and China, that same percentile spans roughly 140 million—underscoring the scale advantage for investors seeking volume-based returns.
Strategic Investment Requires Context
At Dawgen Global, we believe that informed investment begins with understanding the broader socioeconomic context—not just economic growth headlines or GDP charts. A country may boast high average growth rates, but that growth may not be inclusive or evenly distributed. Investors must dig deeper. The true opportunities—and the hidden risks—often lie in understanding who is growing within that economy, and by how much.
Income inequality, as revealed in the data, isn’t just a social issue; it’s an indicator of market potential, political stability, and future economic trajectory. Let’s break this down:
Segment Markets More Precisely
Instead of viewing nations as monolithic markets, income distribution data allows for micro-segmentation:
-
Who are the top earners?
-
Where are the emerging middle classes?
-
Which regions are underserved?
For example, in countries like India or Indonesia, the top 10% represents a significant, affluent consumer base—potentially larger in absolute numbers than the population of entire smaller nations. Tailoring your investment or product strategy to reach these specific income segments enhances ROI and reduces waste.
Develop Localized Pricing Strategies
Standardized global pricing models fail in regions with wide income disparities. The data shows that even within relatively affluent countries, disparities are sharp. A one-size-fits-all approach to pricing can alienate large swaths of potential customers—or underprice offerings for wealthier tiers.
-
Premium products may thrive in urban hubs while needing adjusted value models for rural areas.
-
Subscription services, installment plans, or freemium models may cater better to lower-income segments.
Anticipate Social and Economic Risks
Wide income gaps often correlate with:
-
Political instability
-
Civil unrest
-
Policy volatility
-
Currency fluctuations
Investors need to assess not just the average income, but the inequality within. Sudden regulatory changes, populist movements, or shifting tax policies can follow from perceived or real inequality. This understanding should factor into risk assessment and market entry strategies.
Align Products with Real Purchasing Power
Just because GDP per capita is rising doesn’t mean disposable income is increasing across all segments. High food, fuel, or housing costs may consume a disproportionate share of income, especially in lower percentiles.
PPP-adjusted income data helps investors:
-
Set realistic sales targets
-
Design affordable financing options
-
Prioritize essential vs. luxury products in rollout plans
Understanding the true day-to-day economic reality for consumers enables you to meet them where they are—not where the averages say they should be.
Conclusion: Income Inequality Shapes Investment Reality
The data is clear: where you invest—and whom you target—can make or break your strategy. High-income economies may offer saturation but stable returns. Emerging markets may offer scale but require nuance. In all cases, ignoring income distribution is a missed opportunity.
At Dawgen Global, we guide our clients to make Smarter and More Effective Decisions—grounded in data, shaped by strategy, and focused on long-term value. Income inequality isn’t just a development metric—it’s a lens for investment intelligence.
Next Step!
“Embrace BIG FIRM capabilities without the big firm price at Dawgen Global, your committed partner in carving a pathway to continual progress in the vibrant Caribbean region. Our integrated, multidisciplinary approach is finely tuned to address the unique intricacies and lucrative prospects that the region has to offer. Offering a rich array of services, including audit, accounting, tax, IT, HR, risk management, and more, we facilitate smarter and more effective decisions that set the stage for unprecedented triumphs. Let’s collaborate and craft a future where every decision is a steppingstone to greater success. Reach out to explore a partnership that promises not just growth but a future beaming with opportunities and achievements.
✉️ Email: [email protected] 🌐 Visit: Dawgen Global Website
📞 Caribbean Office: +1876-6655926 / 876-9293670/876-9265210 📲 WhatsApp Global: +1 876 5544445
📞 USA Office: 855-354-2447
Join hands with Dawgen Global. Together, let’s venture into a future brimming with opportunities and achievements

